 The COVID-19 pandemic has led to significant changes in how people have vacationed in 2020.
To get away from it all without spending time in crowded places, vacationers have turned to vacation rental websites and have planned longer stays. For example, Airbnb recently reported a year-to-year doubling of long-term (>28 days) rentals and a shift from urban to rural stays.
These changes make sense given how many people have been working from home. If all you need to work is a reliable Internet connection, then “home” can be wherever you are.
To better understand this domain, we benchmarked the user experience of the following three vacation rental websites to see how people are using these services and how they can be improved:
- Airbnb (airbnb.com)
- HomeAway (homeaway.com)
- Vrbo (vrbo.com)
We collected SUPR-Q data, including Net Promoter Scores, investigated reasons people use these services, measured users’ attitudes regarding their experiences, and analyzed reported usability problems.
Note: HomeAway and Vrbo are owned by the same company. After completing our data collection but before publishing this report, homeaway.com began redirecting to vrbo.com.
Benchmark Study Details
In August 2020, 163 US residents participated in a retrospective study in which we asked people who had used at least one vacation rental service in the past year to reflect on their experiences. In addition to benchmarking, we also had 346 participants complete a MUIQ open card sort of Airbnb’s filtering options.
Participants completed the eight-item SUPR-Q (including the Net Promoter Score) and UMUX-Lite standardized questionnaires and answered questions about brand attitudes, usage, and their prior experiences.
Quality of the Vacation Rental Website User Experience: SUPR-Q
The SUPR-Q is a standardized measure of the quality of a website’s user experience and is a good way to gauge users’ attitudes. It’s based on a rolling database of around 200 websites across dozens of industries, including vacation rental services.
Scores are percentile ranks that tell you how a website experience ranks relative to the other websites. The SUPR-Q provides an overall score, as well as detailed scores in subdimensions of trust, usability, appearance, and loyalty.
The scores for the three vacation rental websites were above average, with percentiles ranging from 83–96 and averaging 90 (better than 90% of the websites in the SUPR-Q database). In this study, Vrbo had the lowest SUPR-Q (83rd percentile), and Airbnb had the best (96th percentile).
Usability Scores and Trust
We asked participants to reflect on how easy they thought it was to use and navigate through the vacation rental websites/apps. Airbnb and Vrbo had the highest usability scores (95th percentile), and HomeAway had the lowest (81st percentile).
Trust scores were closer to average, with a high at the 70th percentile for HomeAway and a low at the 48th percentile for Vrbo (most likely due to prices and fees being unclear at the start of the booking process.)
Loyalty/Net Promoter Scores
The vacation rental websites have an average NPS of about 38%, so there are many more promoters than detractors across the services. In general, better user experiences are a good predictor of higher loyalty.
Use of Vacation Rental Sites and Mobile Apps
As a part of this benchmark, we asked participants how they accessed the vacation rental services and to identify their top tasks. All participants reported using their desktop/laptop computers, with 78% also using mobile websites and 64% using mobile apps.
Users typically visited vacation rental sites a few times a year. The top tasks were browsing (29%), searching by location (17%), and planning a vacation (13%).
Components of the Online Vacation Rental Experience
For a series of five-point scales (see Key Drivers), we computed the top-two box percentages of items that rated components of the vacation rental websites, finding that positive ratings of all components were 72% or higher. Overall, 89% of participants agreed that booking processes were smooth, and 72% indicated it was easy to tell if the property was in a desirable location.
Key Drivers
To better understand what affects SUPR-Q scores, we asked respondents to agree/disagree with the following attributes of the vacation rental websites on a five-point scale from 1 = strongly disagree to 5 = strongly agree. A key driver analysis uses regression modeling to quantify the extent to which ratings on these items drive (account for) variation in overall SUPR-Q scores.
- It’s easy to find a vacation rental to fit my needs.
- The booking process is smooth.
- There is a large selection of vacation rentals to choose from.
- The listing is an accurate depiction of the home.
- The check-in process is easy.
- I can tell if the home is in a desirable location.
- It’s easy to communicate with the homeowners.
- The vacation rental is always clean.
- I can contact customer support if needed.
- Prices and fees are easy to understand.
- It’s easy to narrow down the search results.
- I know what is located nearby my vacation rental.
Key Drivers Include Brand Attitude and Smoothness of Booking Processes
We often find brand attitude to be a major driver of SUPR-Q scores, and this time was no exception, with brand attitude accounting for 12% of the variation in overall SUPR-Q scores. While notable, this is of limited value because brand attitude itself is more of a lagging than leading indicator. Knowing that brand attitude affects SUPR-Q ratings doesn’t provide much specific guidance about what improvements to make.
The top key driver from the list above was “The booking process is smooth” (accounting for 18% of SUPR-Q variation). All three websites received good to excellent top-two box ratings on this component (Airbnb: 93%; Vrbo: 91%; HomeAway: 83%).
The other three significant key drivers were having a large selection of vacation rentals (12%), prices and fees that were easy to understand (12%), and listings that were accurate depictions of the properties (11%).
What to Improve
Key areas of improvement cited by respondents for each website/app include
- Airbnb: Misleading fees (e.g., “The prices don’t include service fees etc. so what you see when doing the initial search is not what you pay.”)
- HomeAway: Unwanted emails/contact (e.g., “I don’t feel like I can save future trip ideas without being bombarded by information I don’t want.”)
- Vrbo: Misleading rentals (e.g., “I feel that sometimes rentals are built up and are not quite what they seem. On occasion, I have to go the extra mile sometimes to validate a listing.”)
Open Card Sort of Airbnb Filtering Options
In addition to the benchmark survey, 346 respondents used the open card sort capability of MUIQ to organize 58 Airbnb filtering options. Analysis of the sort data indicated seven high-level categories: Rental Type, Lodging/Type, Rooms, Features/Location, Amenities/Rules, Amenities, and Language. Figure 1 shows the Lodging/Type portion of the dendrogram from a cluster analysis of the card sort data. This user-generated taxonomy may be helpful for designers who are looking for how to organize both property filters and descriptions on the property detail pages.
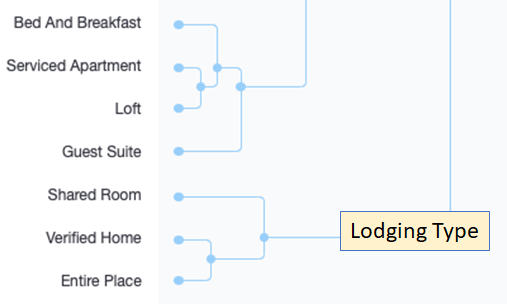
Figure 1: Lodging/Type portion of the Airbnb open card sort dendrogram.
Summary and Takeaways
An analysis of the user experience of three vacation rental websites/apps found that
- All these vacation rental websites/apps had above average UX and NPS. The websites had SUPR-Q scores ranging from the 83rd to the 96th percentiles (where the 50th percentile is average). The NPS reflects these positive scores with an average of 38% (substantially more promoters than detractors).
- Users did not visit the websites frequently, but when used, there was a high level of mobile use. The typical frequency of use was, unsurprisingly, a few times a year. Mobile websites were used by 78% of participants, and 64% reported using mobile apps. The most common activities were browsing, searching by location, and planning a vacation.
- The most important key driver was the smoothness of booking processes. In addition to brand attitude, other key drivers included having a large selection of vacation rentals, prices and fees that were easy to understand, and listings that were accurate depictions of properties.
NOTE: Since 2006, Vrbo and HomeAway have been owned by the same company. After completing our data collection, but before publishing this report, homeaway.com began redirecting to vrbo.com. Our findings generally indicate that homeaway.com had a better user experience and generated more loyalty than vrbo.com, so it will be interesting to see if vrbo.com will adopt the elements of homeaway.com that improve the UX.
Full details are available in the downloadable report.


