 The Single Ease Question (SEQ) is a 7-point rating scale to assess how difficult users find a task.
It’s administered immediately after a user attempts a task in a usability test.
- After users attempt a task, ask them this simple question: Overall, how difficult or easy was the task to complete? Use the seven point rating scale format below.
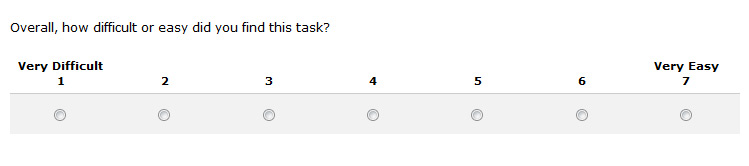
- Labels and values: We typically label the end points only and provide numbers from 1 to 7. There are many variations on this (labeling all points, not numbering etc.) but we’ve found these slight changes are far outweighed by the very salient event of the just attempted task. Users are generally very aware of nuances involved in trying to find information or complete a function and have little problem expressing their frustration or delight.
- It works well: Despite its simplicity, we found the SEQ performed about as well or better[pdf] than more complicated measures of task-difficulty like the interval scaled Subjective Mental Effort Questionnaire (SMEQ) or the ratio scaled Usability Magnitude Estimation. That’s good considering you can administer the SEQ in any questionnaire software, on paper or aurally.
- Ratings of difficulty correlate with other metrics: We’ve found that in general, the correlation[pdf] between user responses on the SEQ and task-time and task-completion is around r =.5. That is, users tend to rate tasks more difficult if they take longer or don’t succeed at all. The correlation is not so strong that any single usability metric is a replacement for another, but it does tell us that the metrics are measuring overlapping things.
- Users respond differently: One thing you’ll notice when administering the SEQ in particular and most questionnaires in general, is that some users will make everything a 6 or 7 while others will use the full range of the scale (going from 1s to 7s) within the same study. This sort of behavior can be troubling and leads some to dismiss rating scales altogether. However, it’s very common for people to use rating scales differently, but these differences tend to average out across tasks and products. It’s also why we look at the average response relative to a database instead of solely relying on top-boxes scores.
- Extremely easy but task-failure: We do observe users who have a horrible time with a task yet watch in awe as they rate the task as extremely easy! When this happens we all remember, tell our friends and again some unfortunately dismiss rating scales altogether. Yet, in examining data from thousands of responses we find this only happens around 14% of the time. This reminds us that measuring human behavior and attitudes is notoriously difficult but not intractable. We are still able to measure sentiments of usability, just don’t expect the instruments to be like thermometers where every rise in the mercury is associated with a rise in temperature.
- The average SEQ score is around a 5.5 : Across the over 400 tasks and 10,000 users we find the average score hovers between about 5.3 and 5.6. This is above the nominal midpoint of 4 but is typical for 7 point scales. Note: The historical average was updated in May 2019 based on years of new data.
- Technology Agnostic: We use the SEQ on mobile devices, websites, consumer and business software and even tasks on paper prototypes. That’s the beauty of task-difficulty ratings: users tend to respond to what they expect given the device, fidelity of the interface and nature of the task. It’s also why we use the SEQ as a great longitudinal measure from iteration to iteration.
- Ask Why? : When users rate a task difficult, it’s good to know why they did. When a user provides a rating of less than 5 we ask them to briefly describe why they found the task difficult. This provides immediate diagnostics information right when the user is cognizant of what is driving the poor rating.
- Helpful when used alone and in a competitive setting: We find that some tasks are inherently more difficult than others. For example, determining if you have to pay to fix your neighbor’s fence if a tree falls on it in a storm is a more complicated task than locating a 32″ flat screen TV on a retail website. It’s difficult for users to disassociate the complexity of the task with problems they had trying to complete it. When possible we like to see how users do when attempting the same task on a comparable website to really gauge how difficult the task is relative to its inherent complexity.


