 Yes, of course you can.
But it depends on who you ask!
It’s a common question and point of contention when measuring human behavior using multi-point rating scales.
Can you take the average of a Likert item (or Likert-type item) similar to the following?
The website is easy to use:
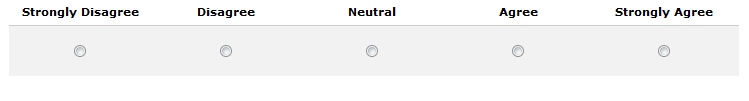
Here’s how 62 participants after using the Budget rental car website responded (with corresponding values):
| Coded Valued | Response Option |
# Responding |
| 5 | Strongly Agree | 26 |
| 4 | Agree | 22 |
| 3 | Neutral | 7 |
| 2 | Disagree | 5 |
| 1 | Strongly Disagree | 2 |
If we assign numbers from 1 to 5 for each category label (Strongly Disagree = 1, Strongly Agree = 5) we create an ordered set of categories called ordinal data. If we then take the average of the 62 coded responses, the result is 4.05, or about 4. Is such an operation permissible? And what exactly does a 4 mean in this context?
The Cautious Approach
Some people (in industry and academia) would say not only is it not allowed, the result is meaningless.
For example, the author of a guide for statistics students at a prestigious university says it means nothing:
“With Likert scale data we cannot use the mean as a measure of central tendency as it has no meaning i.e.what is the average of Strongly agree and disagree?”
The guide goes on to recommend the “right” way to analyze Likert data:
“The most appropriate measure is the mode the most frequent responses, or the median. The best way to display the distribution of responses i.e. (% that agree, disagree etc.) is to use a bar chart.”
The term ordinal, as used in the field of measurement, comes from the work of SS Stevens, who delineated four levels of measurement[pdf]: nominal, ordinal, interval, and ratio.
While the categorization seems uncontroversial, Stevens went so far as to say that the level of measurement dictates what you can do with the numbers. He said you can only take the mean and standard deviation of data if it’s at least the interval level. But not everyone agreed with that then nor do they now—something we discuss in more detail in Chapter 9 of Quantifying the User Experience.
Differing Perspectives
Most people assume that when numbers are involved there’s a clear right or wrong answer. What a lot of people don’t realize is that the answer to this question is more like asking someone if the government should more strongly regulate trade and less like does 2+2 = 4? The answer to a political question will of course depend on who you ask! The answer is influenced by that person’s particular world views.
As much as the media depicts science as some sort of book of facts—unchanging and written with consensus—the truth is that science in general and measurement in particular are in flux with people differing on theory, the interpretation of facts, and often on the very facts themselves.
Like a political ideological spectrum from liberal to conservative, there is also a statistical spectrum from liberal to conservative [pdf]. People who tend to be more liberal in statistics and measurement tend to relax rules and theory when it serves useful purposes (like me). In contrast, those who are more conservative tend to be much more rigid with theories and rules and are reluctant to bend them, even if it generates fruitful results. Knowing where your professor or the author of a book or website falls on that spectrum will help you understand why they recommend or prohibit certain operations.
Different Approaches, Similar Conclusions
In fact, even the progenitor of this rigid thinking, Stevens himself, acknowledged that taking the mean of ordinal data will in many cases lead to fruitful results. The good news for practitioners who are less concerned with theory and just want to do the “right” thing is that in many cases, the differing approaches lead to similar conclusions.
For example, we can use the mode (the “approved” measure of central tendency) for summarizing Likert data. From the example above the most common response (the mode) is Neutral, with 17 (27%) of the participants picking it. To me, this is about as informative as knowing the mean response is 4. And it so happens the median is also 4. But if you think using the median instead of the mean or mode is a panacea, that cure is often worse than the purported problem.
Whether you take the mean, median, or mode, you still have a similar challenge with interpretation. The challenge to the researcher is less in how to summarize raw responses, but in how you derive meaning from the numbers. To make any measure meaningful, we have to compare it to something.
Compared to What?
For example we can compare the responses from the same participants who rented a car on the Enterprise website.
| Coded Valued | Response Option |
# Responding |
| 5 | Strongly Agree | 7 |
| 4 | Agree | 16 |
| 3 | Neutral | 17 |
| 2 | Disagree | 13 |
| 1 | Strongly Disagree | 9 |
Again assigning numbers to the categories we get a mean of 2.98, or about 3. Some would say this 3 is also meaningless. But now we know that mean is a full point below the Budget mean of 4. This difference is also visible in the bar chart of the frequency distributions for both websites below.
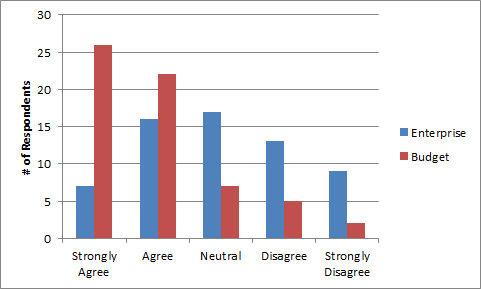
While I’m committing a measurement transgression (to some people), I can further transgress and find the standard deviation and even conduct a paired-t test on this data. Doing so tells us the probability of getting a 1 point difference between Enterprise and Budget—if there really is no difference—is less than 1 in 1000 (p <.001). In other words, there’s a statistically significant difference in ratings between Budget and Enterprise.
The frequency distribution also shows this relationship. We’d reach the same conclusion if we used a more rigid approach and examined only the differences in categorical responses. The proportion of responses that strongly agree on both websites (42% vs. 11%) is also statistically significant using the McNemar Chi-Square test (p<.001).
And even without the comparison to Enterprise, we know something about the general response patterns to 5-point scales. Responses of 80% or higher of the maximum score suggest above average agreement. In other words, people probably think the Budget website is more easy to use than not.
A Few Things to Keep in Mind When Averaging Ordinal Data
When working with items with multi-point response options, especially the 5-point Likert variety, keep a few things in mind:
- Some people will object to you taking the mean of this data, and more times than not will tell you what you’re doing is wrong or impermissible.
- Whether someone tells you it’s permissible to take the average of ordinal data depends on their view of measurement theory—and not all people agree.
- Despite disagreement on the permissibility of operations on ordinal data, doing so is usually helpful in making decisions in user research—something even the most rigid thinker would have a hard time disputing.
- You’ll often reach similar conclusions whether you use mode, median, or mean.
- The mean and standard deviation however have the advantage of often revealing statistical differences at smaller sample sizes—which is one of the reasons I recommend the approach.
- While some people have an issue with the mean of a single ordinal item, far fewer take issue with averaging multiple Likert items, such as those on the SUS or SUPR-Q® as it offers a more continuous and interval-like measure.
- Be careful with the interpretation of ordinal data. Using the mean of ordinal data is fine; just be careful not to make interval or ratio statements about your data — even researchers who take a more relaxed view of averaging ordinal data would disagree with that practice. While we can say that the mean rating is higher on Budget, we can’t say that participants find the Budget website 1 unit easier than Enterprise—that’s an interval statement. And we certainly can’t say Budget is 36% more usable than Enterprise—that’s a ratio statement.


