 You’ve seen them.
You’ve answered them.
It seems like everyone has an opinion about them.
Here are five things to know about the famous Likert scale. (One for each response option!)
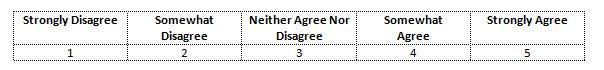
- The Likert scale was developed and named after psychologist Rensis Likert. The now ubiquitous Likert scale consists of multiple items. Participants are asked to rate their level of agreement to items that describe a topic, like customer satisfaction, usability, or loyalty. The response format usually ranges from Strongly Disagree to Strongly Agree, with a neutral option along with numbered values as shown in the figure below.
Note that many of Likert’s original response options [pdf] used “approve” instead of agree, but many of the measurement establishment consider “agree” to be the pure Likert response format.
- A Likert scale consists of an average or sum of multiple Likert items. Responses are coded typically from 1 to 5 and averaged or summed (although any set of numbers would work, such as from 0 to 4). For example, the SUPR-Q uses an 8-item Likert scale and averages the responses from 1 to 5.
You may come across advice not to use the mean because Likert data isn’t interval and that you should use the median or mode. As with many things in statistics there is disagreement. Don’t be afraid of using the mean. For a discussion on why I recommend using the mean, see Chapter 9 in Quantifying the User Experience.
- A Likert response format usually has only 5 response options. The most common used response format provides five options from Strongly Disagree to Strongly Agree. Most measurement experts (and journal reviewers) consider calling anything else, like a 7-point Likert scale, incorrect. If you did I wouldn’t care, but be prepared for the picky to get mad. To be on the safe side, call any variation on labels or number of response options a Likert-type scale.
And keep in mind, you don’t need to stick with just five points–it’s just what’s most associated with a Likert scale. And whatever you do, don’t call a single Likert item a Likert Scale–that will get everyone mad. The scale is the average or sum of all items.
- A Likert scale produces ordinal data. The difference between a 2 and 3 on the 5-point scale isn’t necessarily the same as the difference between a 4 and 5 (that’s the difference between ordinal and interval data). While a Likert item is technically discrete data, you can treat the average of many Likert items as continuous data—where you compute a mean, standard deviation, and confidence interval.
There’s nothing wrong with using the mean and corresponding statistical tests like the t-test; just be careful not to make statements like “customers were twice as satisfied.” While a value of a 4 is twice that of a 2, when the data isn’t ratio scaled, it’s risky to make that statement. To be safe, just say the average satisfaction rating was twice as high. An advanced technique, called Rasch Modeling, logit transforms the original ordinal data and converts it to interval data, which allows for better interpretation.
- It’s pronounced LICK-ert. But I, like most others, mispronounce it as LIKE-ert, because well, it sounds better and makes so much sense— a scale about something you like! After all, the Rasch model, named after Georg Rasch, is pronounced in Danish like red itchy skin but is now pronounced R-ah-sch because it sounds better. So I’m sticking with LIKE-ert. Don’t you strongly agree?
Find out more about Likert scales and measurement best practices at the Denver UX Boot Camp.


