Benchmarking the user experience of a website, app, or product is essential to understanding how the experience is for your users and if you’re making effective changes to the interface over time.
A UX benchmark is similar to going to the doctor to get your blood pressure, weight, and cholesterol checked. You get a series of quantitative measures that help you understand how healthy you are.
You also get some idea about how you compare to the rest of the population. When things don’t look right, you make a plan to improve your numbers.
Benchmarking is part of maintaining a healthy user experience for your product. You can get practice conducting your own at the UX Boot camp in Rome and Denver. Here is a list of common points to discuss and decide when embarking on a benchmarking project.
When should you conduct a UX benchmark?
There are usually two good times and reasons to conduct a benchmark.
- When you know you’re going to make changes. All too often we think that any change we make to an interface will improve it. And for some horrible interfaces, that might be the case. But even then you should benchmark so that you understand which changes quantifiably help, hurt, or have little effect on the user experience. This is a key tenant in the framework for improving the user experience.
- When you need to calculate a Return On Investment (ROI). In order to know when your efforts to improve the interface are worth it (especially in terms of cost and time), benchmark the experience before and after changes.
How long do benchmarks studies take?
Studies typically last between 4 and 12 weeks. At a minimum, it takes a week to plan the tasks, questions, and study details; a week or two to collect data; and a week to finalize a report with statistical analysis and insights into what’s driving the numbers.
Often though, plan to take several weeks to get the tasks and questions right and to iterate them with the right stakeholders (and get time on everyone’s calendar). For more complicated studies, it takes longer to be sure the product(s) are available and properly configured; it can also take longer to facilitate and then analyze results.
Should it be a comparative or a standalone study?
Benchmarking is an excellent way to get a pulse on your product experience. However, for an initial benchmark one of the first reactions we get to the data is, “Is that good or bad?” One way to help answer that is with external benchmarks that we provide (like the SUPR-Q, SUS, SEQ, and SUM). However, some tasks can be naturally more complicated.
One of the best ways to understand if it’s the task or application that’s less than usable is by conducting the same tasks with a competitor’s product (or best in class comparison). If it takes twice as long to complete the same task on your experience relative to the competition, then you can have more confidence that an improvement is needed and it’s not the task complexity. If you go with a comparative study, you’ll need to weigh the pros and cons of using a between- or within-subjects study.
Who are the users?
If you’re considering benchmarking, you probably have some idea who your users are. But be sure any assumptions you make about your users are substantiated with actual data (e.g., internal surveys or third-party reports). It doesn’t make sense to spend all the effort on a benchmark if you test with users you think use your app instead of the users who actually do!
You’ll also want to identify any meaningful subgroups of users. For example, teachers versus students, buyers versus sellers. If you want to generate precise metrics for each subgroup, this affects the sample size. Having personas and segments planned out before a benchmark can be helpful. However, it’s often not necessary (or possible) to recruit strictly against every persona or customer segment.
Will you be able to get access to users?
For popular consumer websites, software, and apps, finding qualified users shouldn’t be too difficult. For products or websites with specialized users, finding participants can become a challenge. For certain B2B products users can be highly technical, geographically spread out, and very unavailable. You’ll want to identify the upper limits on the necessary sample size prior to conducting the study rather than going in with unrealistic expectations about the sample size.
What will the tasks be?
You can rarely test an entire application; instead you’ll want to narrow down your study to 5-10 tasks per benchmark (fewer when you go with a within-subjects study). It’s difficult to ask even paid participants to be diligent for more than an hour for a moderated study and 30 minutes for an unmoderated study.
Focus on the tasks and functions that are most important to users. You can focus on less-used tasks if there is an expected change, if it’s a known problem area, or you’re benchmarking for that specific data.
What metrics will you collect?
For most benchmarks, we typically start with our core set of task metrics (completion rates, time, and perceived ease) and study metrics (SUPR-Q or SUS), then work with stakeholders to convert business goals into the right metrics and approaches. The metrics cover both attitudes and actions; and with external benchmarks, we can compare the scores at the task and study level. Even though benchmarking primarily generates metrics, you’ll also want to document the problems in the experience so you know what to fix.
Will you (and the users) have access to the products?
For consumer websites access shouldn’t be an issue. But for more complicated software or hardware that requires customization, new versions, or working prototypes, it can be a challenge to get the right product. This is especially the case with a competitive benchmark. Be sure you know when and how you’ll access your interfaces.
Do you need a moderated or unmoderated study?
For websites, web apps, and mobile apps, you can have users access these from anywhere in the world. This allows you to conduct an unmoderated study, which usually means you can collect data from a much larger sample size at a fraction of the cost of a moderated study. A moderated (remote or in-person) study limits the sample size because you’ll need to schedule a facilitator with each participant. In some situations we use a technique called “bleacher usability testing” where a facilitator monitors multiple simultaneous users. This allows us to collect a lot of data quickly, even from a moderated study.
Will you conduct a retrospective or concurrent study?
Sometimes it’s difficult to simulate a realistic task experience or get access to the right version of the product or find actual users. All is not lost. In such cases, you can generate a benchmark about the perception of the user experience. The user experience (like usability) is measured as a combination of attitudes and actions. If you can get half the equation then it’s better than none of it.
You can assess attitudes toward UX by having your users answer a series of standardized questions (for example, the SUS or SUPR-Q) along with questions about specific features, task experiences, future intent, and branding. Use this to understand where things are from a higher level, and then consider using targeted usability tests or inspection methods to understand the root causes of lower metrics. Measure using the same approach and look for changes that happen over time.
How precise do you need to be?
One of the main motivations for benchmarking is to track changes over time. You therefore need a large enough sample size to differentiate random noise from real changes. After you’ve decided to make the study standalone or comparative (and if comparative, a within- or between-subjects study) and the needed subgroups of users, you can compute the needed sample size.
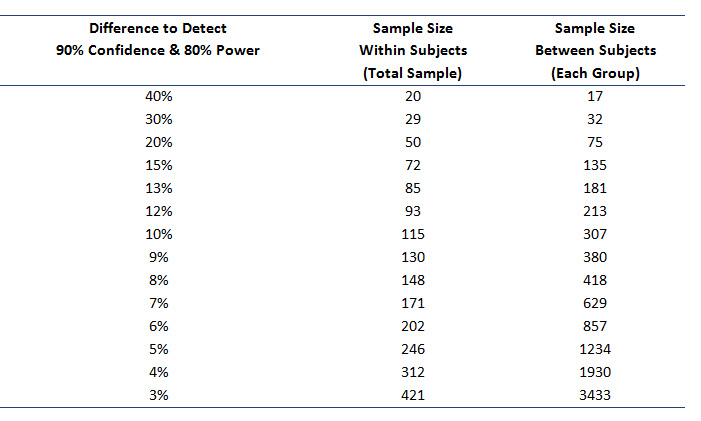
There isn’t a magic sample size (like 30 or 100) that will work for every benchmark study. The figure below shows the sample size you should plan on to detect differences of different sizes between each benchmark. We use two strategies when arriving at the best sample size for a table like this.
- With the first approach, we work backward from a sample size that matches the budget and time frame. A fast timeline and high cost per participant mean sample sizes need to stay small. For an unmoderated study a sample size between 150 and 200 is common. At that sample size you should be able to detect differences around +/- 12% compared to future benchmarks. That means if 50% of your users complete the task now, and 62% complete the task a year later, that difference would be statistically significant.
- The second approach we take is more mathematical and we work backward from the desired difference to be detected. For example, to detect differences as small as 8%, we’d need to have a sample size of 400. These numbers assume a worst-case scenario of variability based on binary metrics. (See Chapter 6 in Quantifying the User Experience for more details.)
But even if you can only run a few users—say 30—you can still detect differences, especially in a within-subjects study (if you’re doing a comparative study). Keep in mind you’re limited to only seeing very large differences (30%+) unless the variability in your metrics is low.