 As part of the recent UPA Salary Survey I conducted a deep-dive into the nominal differences in salary between men and women.
Most of the responses came from the US (70%) and the international currencies were converted into US dollars.
Men make around 4.4% more
The first thing I looked at was the median salary in aggregate between genders. In total there were responses from 561 women and 552 men. The graph below shows men reported making about $4k more than women (4.4% higher).
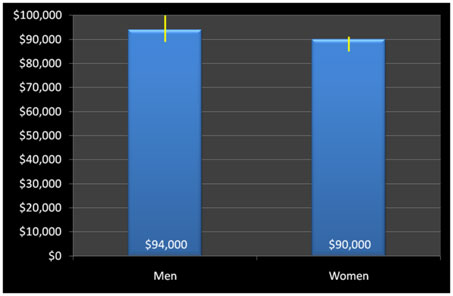
Figure 1: Overall median salary differences between men and women. Yellow error bars are 95% confidence intervals.
As with many socioeconomic variables like gender, ethnicity and age it’s important to dig deeper to see what other variables may be confounding the relationship. So please read on.
Experience Matters
When we look at years of experience by gender an interesting pattern emerges. At the lowest levels of experience, men and women are statistically indistinguishable. In fact, women are reporting slightly higher salary levels—between $4k and $8k more than men.
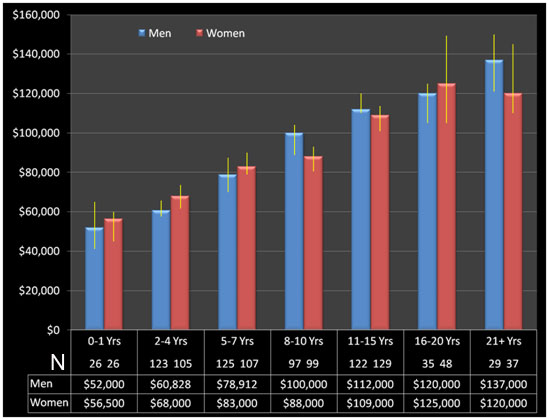
Figure 2: Median salary differences between men and women by years of experience. Yellow error bars are 95% confidence intervals.
This pattern holds until 8-10 years of experience where women suddenly report statistically lower salaries than men ($100k vs $88k). This pattern holds for most of the higher years of experience–women tend to make less than men.
Age 36: The Salary Separator
Age and years of experience are closely related but not identical. You can be starting a second career at 40 (maybe you got tired of being an accountant) and have only 3 years of experience. When we look at salaries for men and women by age cohorts we notice a more salient pattern.
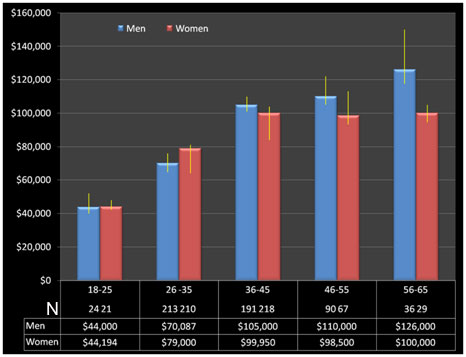
Figure 3: Median salary differences between men and women by age. Yellow error bars are 95% confidence intervals.
Again at first we see men and women with roughly the same median salary–women are actually slightly out earning men (although not statistically). Starting at around age 36 the pattern reverses and holds—women’s salaries in UX never catch up to men’s. At the oldest age cohort (56-65), men make 26% more than women and the difference is statistically significant (notice the non-overlapping confidence intervals).
When we look at the years of experience we see that men tend to have more years of experience for every age cohort. Again this different tends to really manifest itself above age 35.
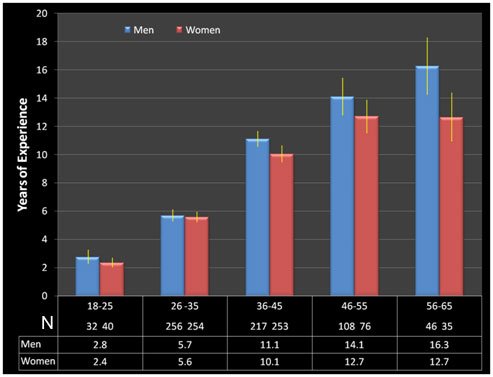
Figure 4: Years of experience by age cohort between men and women. Yellow error bars are 95% confidence intervals.
Starting in the 36-45 age cohort, men report about a year more experience than women. At the highest age cohort, men are reporting almost 4 more years of experience—28% more.
Why the pay gap?
There are probably many reasons for the difference in pay above age 35. Rarely does an outcome in the social sciences have a single cause. Here are some of the more likely candidates:
- Women are discriminated against because of their gender.
- Women bear the bulk of the burden in having and raising children and tend to leave the workforce, reduce hours or not seek promotions.
- Women are much less likely than men to ask for more money in salary negotiations: See the interesting discussion from Carnegie Mellon researchers Babcock and Laschever in the book “Women Don’t Ask” Even women MBA grads who took courses in negotiation were much less likely to ask for more than their male classmates.
- Men tend to overstate their salaries in these surveys more than women: Yes, normally we never exaggerate, but maybe sometimes some of us do?
I ran a factorial ANOVA with salary as the dependent variable and with gender, age and experience as explanatory variables. Gender alone was not a significant predictor, but it was in combination with years of experience and age. This is another corroborating point for what we see in the graphs above (the ANOVA output can be seen in the full UPA report).
Women in UX tend to have less experience than their male peers in the higher age cohorts and this indeed explains the bulk of the salary differences. This suggests factor #2 is playing a major role in explaining salary differences. It is also one of the easier ones to measure and explain, so I suspect it is some combination of all four factors above which explain the difference.
In other studies of gender pay inequities, even when years of experience are accounted for, there are still other unexplained factors at play (e.g. #1, #3 and #4). We should take some comfort in these findings though. Even the overall gap of 4.4% when not accounting for age is a fraction of the 20%-30% gap seen in some professions.
This is the sort of statistical analysis I provide when I design and collect survey data for companies. If you’ve got a good business question and some data, let’s talk.
