Often the most reported measures of usability is task success. Success rates can be converted into a sigma value by using the discrete-binary defect calculation:
Proportion Unsuccessful= Defects/Opportunities
Where opportunities are the total number of tasks and defects are the total number of unsuccessful tasks. This calculation provides a proportion that is equivalent to a success or failure rate. For example, if 143 total tasks were attempted and 123 were successful(20 defects 143 opportunities) the equation would look like:
Converting a Proportion to a Sigma Value
A sigma value is a description of how far a sample or point of data is away from its mean, expressed in standard deviations usually with the Greek letter σ or lower case s. A data point with a higher sigma value will have a higher standard deviation, meaning it is further away from the mean.
Standard deviations and sigma values assume your data is normally distributed from a continuous set of data. A normal curve has a mean of 0 and a standard deviation of 1. Success rates are Discrete-Binary (either a task was completed or it wasn’t) not continuous(like time, weight or temperature) which means that binary data is not normally distributed.
Have no fear, for every statistical problem a statistical solution usually exits. We can treat binary data like continuous data because of the Central Limit Theorem. It states that as a binary sample gets larger, its distribution approximates a continuous distribution.
Approximating the Proportion to a Normal Distribution
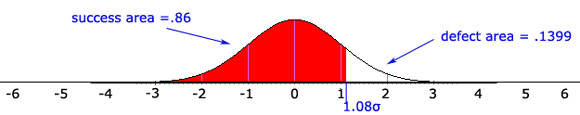
An easy way to exploit the Central Limit Theorem solution and obtain a sigma value from the task proportion is by using the Excel function NORMSINV. NORMSINV approximates the area under a normal bell-shaped curve. Take the unsuccessful proportion .1399–the proportion defective and insert it into the following equation in Excel.
=NORMSINV(1-.1399)
 Note: My sigma values DO NOT contain a 1.5σ adjustment or “shift.”
Task Completion Benchmark
A common benchmark for the percent of users that should complete a task is 90% or 90 out of 100 users that attempt a task should be able to complete it. There are at least two problems with this benchmark:
- For “experienced” users–users that complete the task at least on a weekly or monthly basis, 90% is much too low by definition. If the users complete the task frequently, why would we expect 10% of the tasks not to be completed?
- Task completion by itself tends to only be a good indicator of usability for novice users or an easy measure of a really unusable product for all users. That is, if novice users are only able to complete 50% or 60% of the tasks then you already have a compelling reasons to conclude the product is unusable (for novice users) and don’t need to spend as much time looking deeper for less obvious problems.
The Bottom Line
In a sense, task completion then is a good preliminary test for detecting egregious usability problems or for first time or novice users. I’d continue to use 90% as a goal for novice (never or rarely completed the task) and use 99%+ for experienced (complete the task weekly) users.
The next obvious question is: What is an acceptable sigma level for task completion? Is 6σ attainable?


