If you have an iPhone, you probably love it like I do. You probably also use it a lot like I do. The features and apps and, of course, the user interface make using the iPhone a rich and rewarding experience. Where I once had to wait till I got to my computer to send an email, Google something or get directions from my location, I can now do that from anywhere. In fact, I often send emails from my iPhone while waiting for my PC to boot up.
As I’ve been sending more emails and doing more web browsing, I wondered how much longer these tasks take relative to similar desktop tasks. It definitely takes longer to type on the small electronic iPhone keypad than a full-sized keyboard. To find out how much longer it takes, I conducted a comparative usability test to measure task times.
The Users
I asked eight people to perform the same three tasks on their iPhone and on their computer. All users lived in Denver, Colorado, and had varying amounts of experience with the iPhone, ranging from 1 week to 2 years.
- Send an Email: (a grammatically correct but short email).
- Find a percentage of a number using the Calculator.
- Find the closing price of a stock using Google.
I then asked these users to repeat these tasks to get some idea about learning effects and to give me more stable estimates of task times. Half the users started on their computer and half on the iPhone, and the task order was counterbalanced to reduce sequence effects. Seven of the eight users used a laptop PC and one used a laptop Mac along with their iPhones. All users used their own email client to perform the email tasks (which were a combination of Outlook, Yahoo mail, Thunderbird and Entourage).
Results
Sending an Email: Desktop Wins
As expected, users took longer to type out the emails on their iPhone (p <.05).
Users took about twice as long on the iPhone as they did on their computer to send the same email. They did get faster on their second attempt, but they also got faster on their second attempt with the desktop computer. We can be 95% sure that the average time to send an email on an iPhone for all users would take between 2 and 3 times as long as sending it from a desktop computer.
You might wonder how it is possible to have statistical significance at such a small sample size. It is a common misunderstanding that you need a large sample size in order to use statistics. Sample sizes less than 10 are sufficient for showing statistical differences provided the differences are large. In this situation the difference between sending an email on the desktop and an iPhone is large. It is also easier to detect this difference because the same users were used on both products (called a within-subjects design). Using a within-subjects designs eliminates the variability between users.
Figure 1 below puts a picture around what the statistics tell us. Each numbered dot represents a user’s task time. The darker blue is their first task attempt at sending an email and the lighter blue the second attempt. The first frames of the movie show the times for the iPhone which transition into the times for the desktop. The smaller graphs show the ratio and difference between times. If you’re viewing this from an iPhone you’ll see it as an animated gif instead of a Flash file (which is a whole other topic).
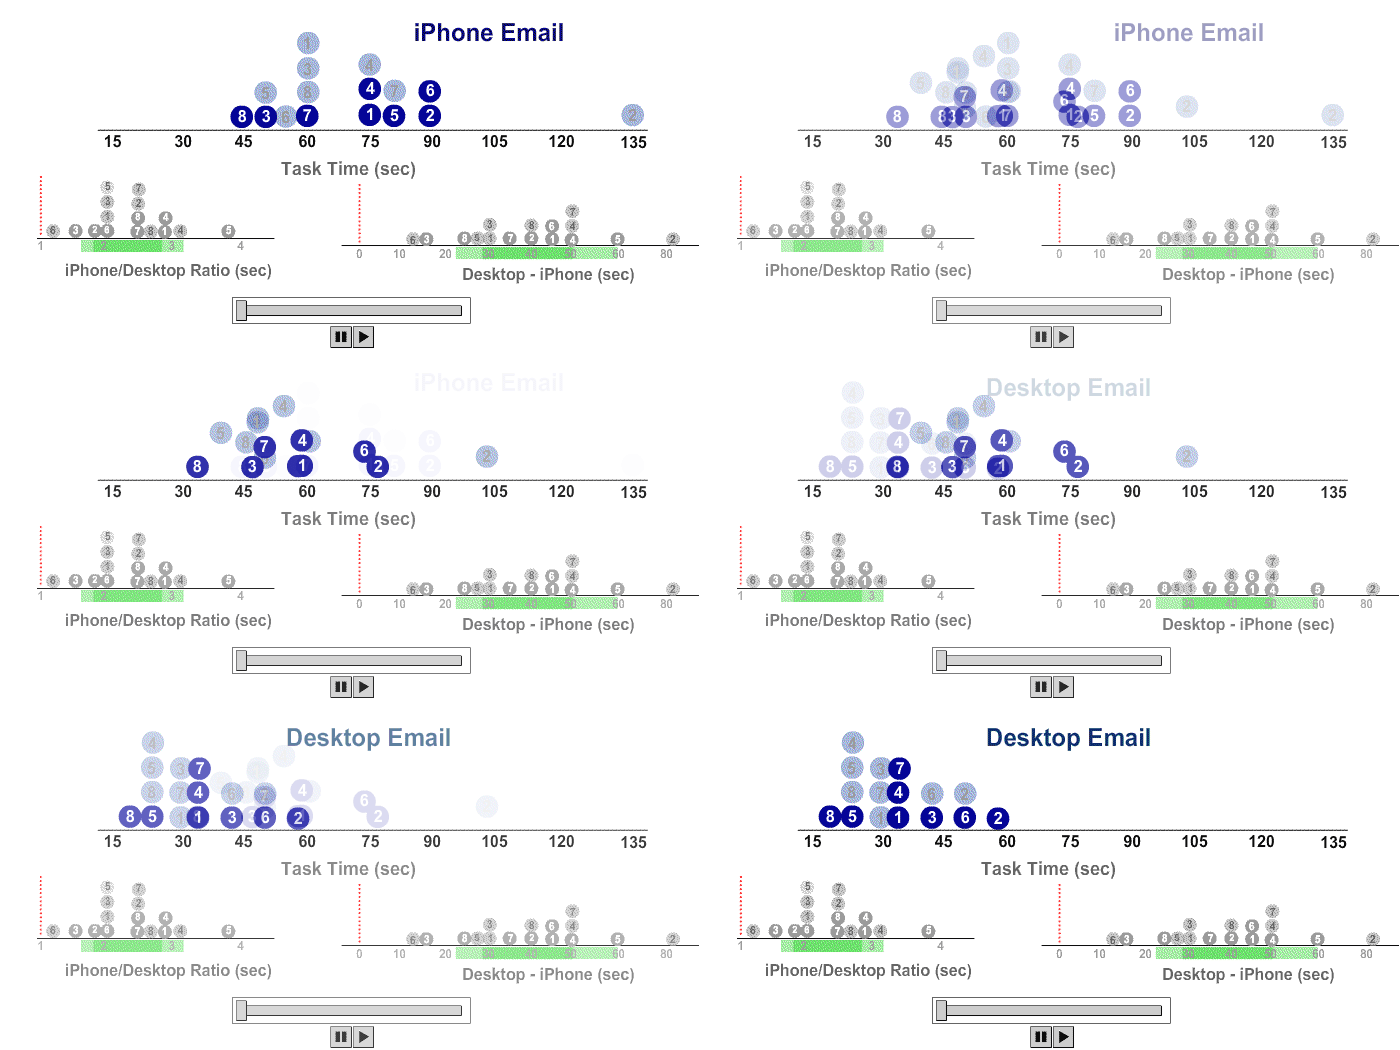 |
| Figure 1: Difference in task times between sending two emails on the iPhone and Desktop. Dots shifting left show a shorter task time for the desktop. Top Graph: Dark blue dots are the 1st task attempt, light blue dots the second attempt. The initial frames are the iPhone and subsequent frames are the desktop times. Lower Left Graph: The ratio of times between the iPhone and Desktop. Dark gray circles are the first task attempt and light gray circles the second attempt. For example, user 4 took about three times as long to send the same email on the iPhone vs. their desktop computer. The red-dashed line indicates no-difference. Green bars are the 95% confidence intervals for both attempts. Lower Right Graph: The difference in times between the iPhone and Desktop. Dark gray circles are the first task attempt and light gray circles the second attempt. For example, user 7 took about 35 seconds more on the iPhone on their first attempt and 50 seconds more on their second attempt. The red-dashed line indicates no-difference.Green bars are the 95% confidence intervals for both attempts. |
Calculator: iPhone Wins/Ties
The layout on the iPhone calculator has much of the look and feel of an actual handheld calculator. Users were able to rapidly point to the numbers and get a result. Probably the hardest part of using the windows calculator is actually getting to it. Only two of the seven Windows users knew how to find the calculator. The task started after the calculator was opened to measure just usage as opposed to OS navigation (which is as important and a topic for another study). Once users had the calculator opened it took longer to get a result on their computer as users had to point and click tiny button using their mouse.
On the second attempt, three users used the numbers on the keyboard for slightly faster performance, making the second attempt not statistically different (p >.20), largely a consequence of the smaller sample size. On average, users took about 50% longer to calculate a percentage on the desktop computer than on the iPhone (95% CI between 28% and 80%).
While we cannot establish that the iPhone is definitely faster, the statistical results here suggest it is highly improbably that the desktop task time is faster–in other words the iPhone either takes just as long or is faster than a desktop calculator application.
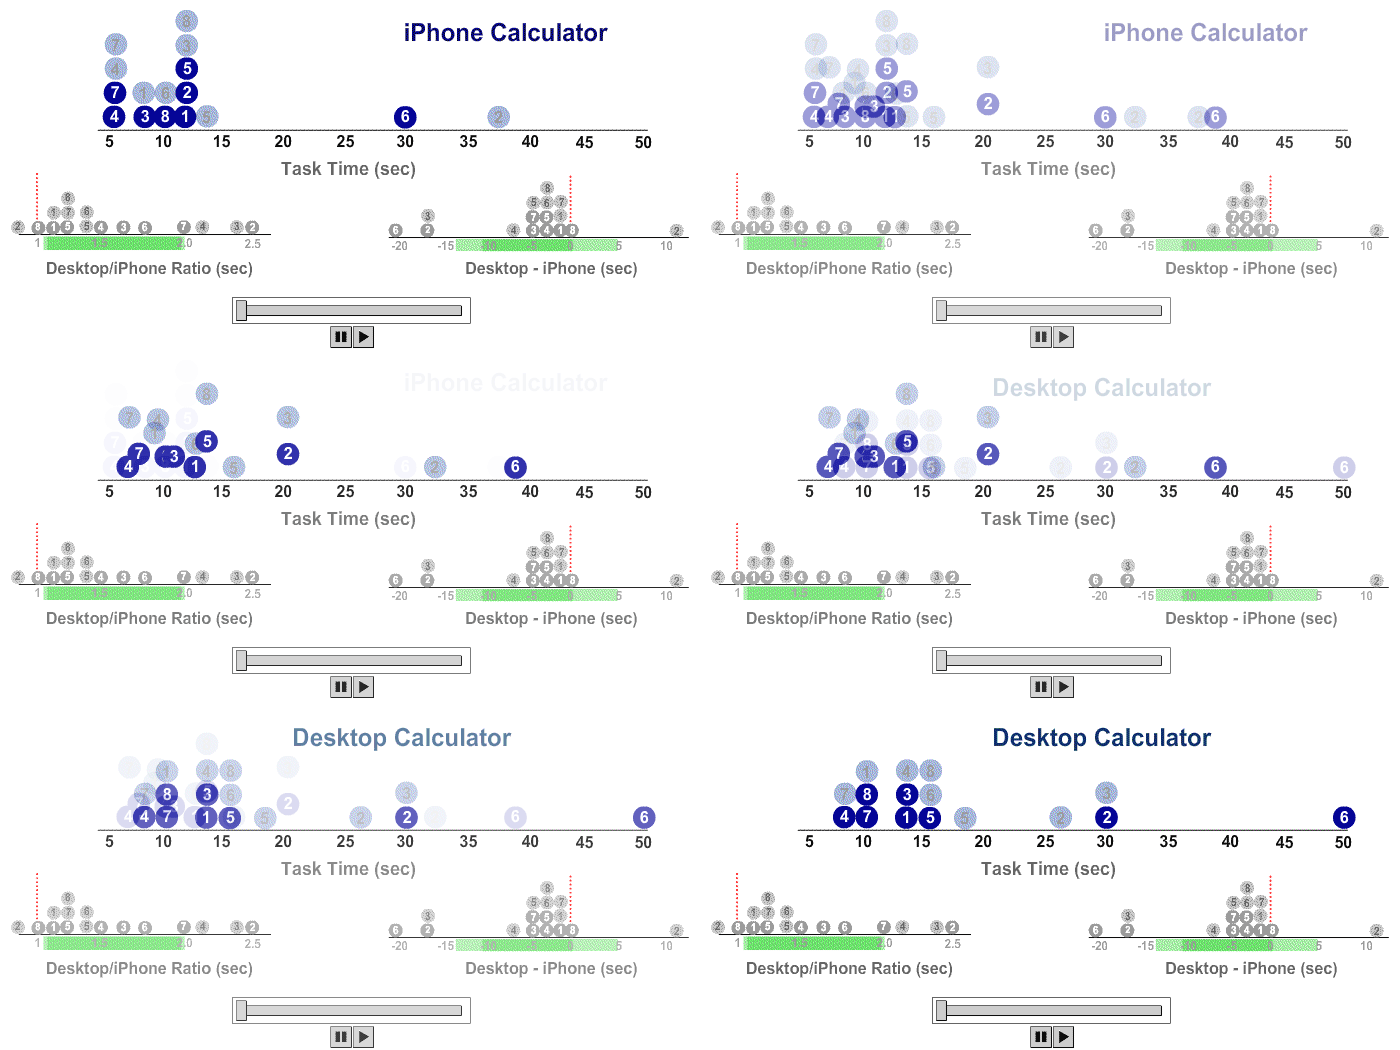 |
| Figure 2: Difference in task times between sending two emails on the iPhone and Desktop. Dots shifting right show the iPhone calculator to take less time. Top Graph: Dark blue dots are the 1st task attempt, light blue dots the second attempt. The initial frames are the iPhone and subsequent frames are the desktop times. Lower Left Graph: The ratio of times between the Desktop and iPhone. Dark gray circles are the first task attempt and light gray circles the second attempt. For example, user 7 took about 1.25 times and twice as long to find a percentage on the Desktop vs. their iPhone. The red-dashed line indicates no-difference. Green bars are the 95% confidence intervals for both attempts. Lower Right Graph: The difference in times between the iPhone and Desktop. Dark gray circles are the first task attempt and light gray circles the second attempt. For example, user 3 took about 5 seconds less on the iPhone on their first attempt and 17 seconds less on their second attempt. The red-dashed line indicates no-difference.Green bars are the 95% confidence intervals for both attempts. |
Google a Stock Price: Desktop Wins
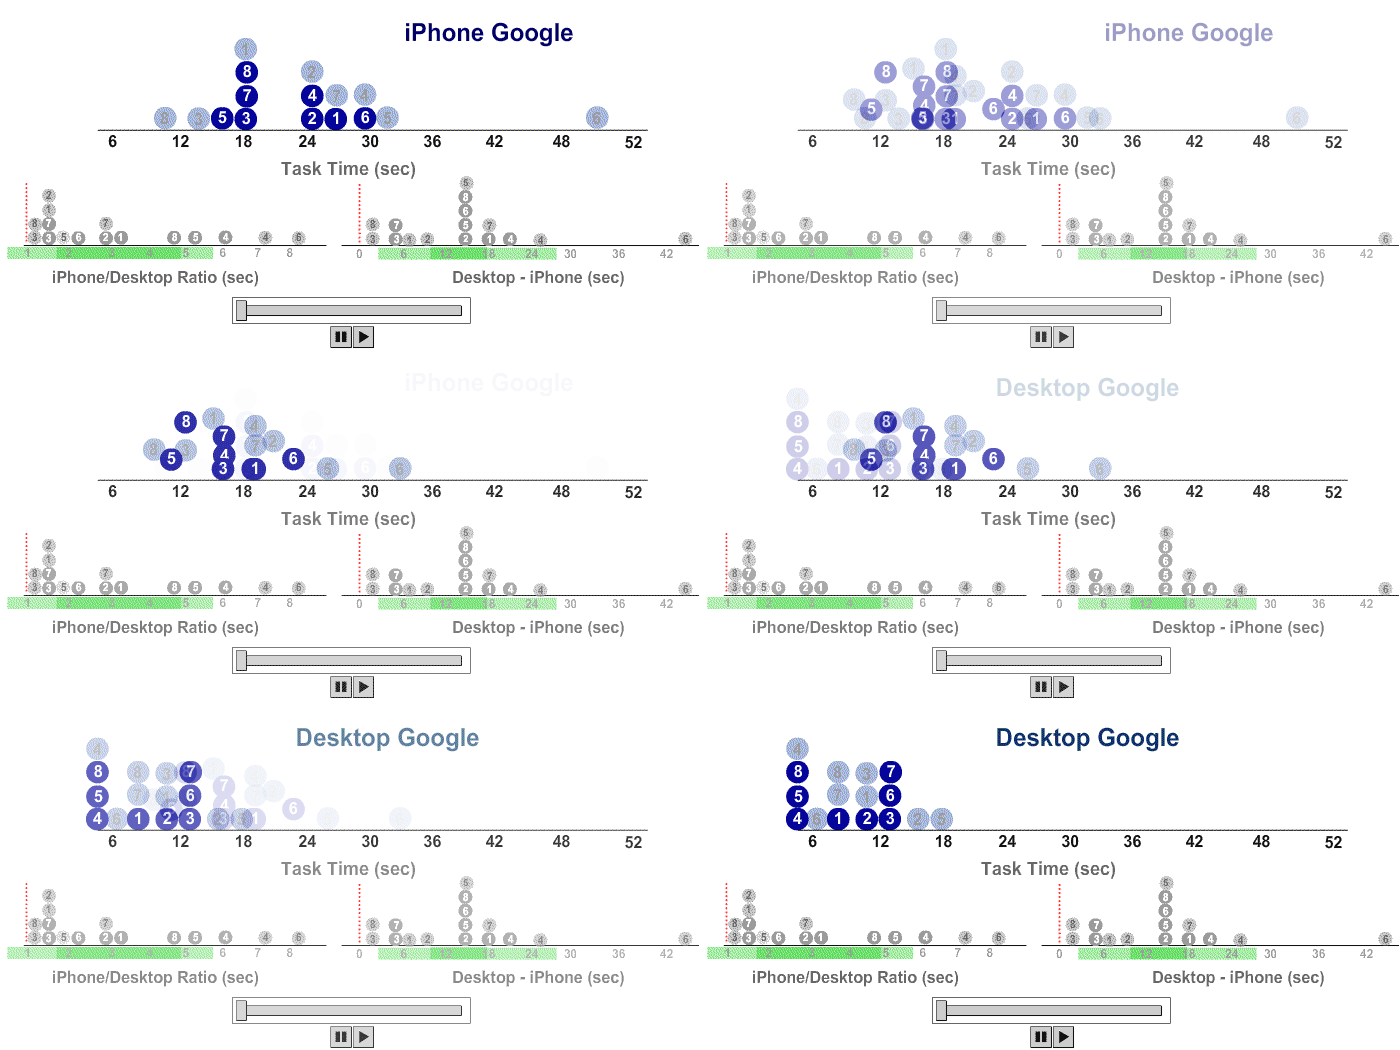
I asked users to use the web-browsers on both the desktop and iPhone to look up the stock price of two companies.
This task could also be accomplished using iPhone’s stock application or any number of web-based portfolio applications. The biggest factor in this task was Internet connection speed. All users had high-speed internet access for desktops and the celluar network for the iPhone. Users started the task with the web-browsers open on both desktop and iPhone. On average, this task took over 3 times as long on the iPhone as it did on a desktop web-browser (95% CI between 2 & 4.5 times).
|
||
Findings
Having portable access to email, the web and numerous applications such as the calculator make the iPhone an indispensable tool. This portability comes at a price for some tasks due to in the increased time it takes to type. For simple web queries and sending emails, expect tasks to take about twice as long on your iPhone compared to a desktop computer. For web-browsing, the additional time is largely a function of the cellular network speed. The additional time for sending emails is due to the limitations of the small keypad. For tasks like finding the right tip at a restaurant, the iPhone calculator offers the best of both worlds. Its portability offers a more efficient experience and you can locate the app much faster than on a desktop computer. For this task, even if you had your laptop out at the restaurant table, it would be faster to take your iPhone out of your pocket and use the calculator application.
Design Take-Away
We’ve all gotten used to mapping our intentions from the screen to our mouse and keyboard, but the touch interface of the iPhone allows for a more natural and intuitive experience. I can’t claim to be a design guru, but I’d say one take-away from this analysis is that if you’re designing applications for the iPhone, try to leverage real-world affordances like those large calculator buttons that have been around since the demise of the slide-rule. Of course, this can go too far, and maybe there are better designs that can lead to more efficient handheld experiences. Perhaps users can come close to matching their desktop typing speed using a Blackberry-type keypad (a topic for another analysis). But for many tasks, if applications just mirrored their real-world counterpart, it would be an improvement in the experience.
