 There are many reasons why usability professionals don’t use statistics and I’ve heard most of them.
Many of the reasons are based on misconceptions about what you can and can’t do with statistics and the advantage they provide in reducing uncertainly and clarifying our recommendations.
Here are nine of the more common misconceptions.
Misconception 1: You need a large sample size to use statistics.
Reality: Small sample sizes limit you to detecting large differences between designs or to discovering common usability problems. Fortunately, large differences and common problems are what matter to users most and especially in early design iterations.
For example, in an early design test of a new homepage design for a large ecommerce website I had the same 13 users attempt 11 tasks on a mockup of the existing homepage and the new design. Four of the 11 tasks had statistically different task times (see Figure 1 below).
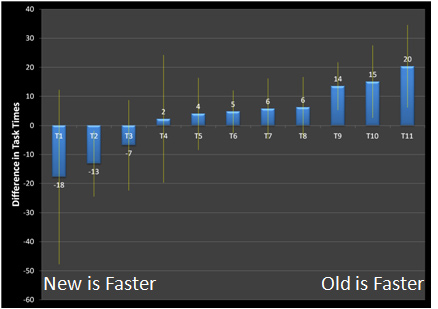
Figure 1: Difference in tasks times for 11 tasks on a new vs existing homepage design. Error bars are 80% confidence intervals.
They were statistically different because users were able to complete three of the tasks more quickly on the old design and one task more quickly on the new design. Even tasks that showed no significant difference provided meaning, even with a major design change, the bulk of tasks are being completed in about the same amount of time.
Technical Note: Don’t think you always need to use 95% confidence intervals or consider something significant only when the p-value is less than .05, this is a convention that many publications use. For applied research you should more evenly balance the priority you give to Type I and Type II errors. See Chapter 9 in Quantifying the User Experience.
Misconception 2: Usability problems are obvious and don’t need quantifying.
If a user trips on a carpet, how many users do you really need to test, much less quantify? (Quote attributed to Jared Spool).
Reality: If usability problems are all as obvious as tripping on a carpet, then what value do trained usability professionals really add? The reality is that many usability problems aren’t that obvious and don’t affect all users. If one user says your carpet is uncomfortable and four others don’t, do you replace it? What if after testing 5, 10 or 15 users no one trips on the carpet? What can you say about the probability someone will?
For example, the first of 13 users we tested on the design of the new homepage had no idea what “Labs” meant (it was referring to upcoming products). Should we change it to something else? Is this a carpet trip or carpet uncomfortable issue? After testing all 13 users only one other user had the problem with the term (2 out of 13 in total). Now should we change it? Understanding the prevalence of this issue can help make a more informed decision and is the subject of the next misconception.
Misconception 3: Statistics are only for summative (benchmark) testing, not formative (find and fix) testing.
Reality: Even if all you collect is a list of usability problems in formative evaluations you can still estimate the prevalence of the problems you observed by providing confidence intervals.
For example, for the two out of 13 users that had a problem associating “labs” with new and upcoming products we can be 90% confident between 4% and 38% of all users would also have some problem understanding the label. There might be a better term, but given the data, at most 38% of users would have some difficulty making the association.
Misconception 4: When users think aloud the data is too variable.
Reality: Thinking aloud and measuring task time aren’t mutually exclusive. You can measure time on task when users think aloud, just wait to probe on issues and ask questions between tasks. The research is mixed on whether thinking aloud actually increases or decreases task times. When possible, have the same users attempt the same tasks on comparable interfaces.
For example, in a test of a new homepage design I had the same 13 users attempt the same 11 tasks while thinking aloud on a mockup of the existing homepage and a new design (this is the data shown in Figure 1 above). The average task time was statistically faster on one task and statistically slower on three tasks (addressing misconceptions 1,2 and 4). Even though the users were thinking aloud, they acted as their own control. Loquacious users were talkative on both the old and new version and reticent users were quiet on both versions.
Misconception 5: You need to show all statistical calculations in your presentations.
Reality: It’s always important to know your audience. Just because you use statistical calculations doesn’t mean you need to bore or confuse your audience with detailed calculations and figures. Even though I advocate a use of statistics doesn’t mean I start every conversation with z-scores.
Often adding error bars to graphs or asterisks to means can allow the audience to differentiate between sampling error and meaningful differences. If Consumer Reports and TV news can provide information about confidence intervals (usually called margin of errors) so can you.
For example, I presented Figure 1 in a presentation to illustrate the difference in task times. During the presentation a Vice President quipped: “I can’t believe you’re showing me confidence intervals on a sample size of 13” (misconception #1).
In response I pointed out that even at this sample size we are seeing significant differences, some better and some worse and that confidence intervals are actually more informative for small sample sizes. With large sample sizes the differences are often significant, but the size of the difference is often modest and unnoticeable to the users.
Misconception 6: Statistics don’t tell you the “why.”
Reality: Statistics tell you the impact of the why. Showing that a usability problem leads to statistically longer task times, lower completion rates and lower satisfaction scores qualifies the severity of a problem and assists with prioritization.
The misconception is that somehow statistics replace descriptions of usability problems. It’s not statistics OR qualitative problem descriptions, it’s statistics AND qualitative problem descriptions.
Misconception 7: If there is a difference it’s obvious from just looking at the data.
Reality: Eye-balling bar charts without any indication of sampling error (shown using error bars) is risky. If the differences really are statistically different, make the computation and show it.
For example, the graph below shows the difference in confidence ratings for two tasks on the homepage comparison test discussed above. The value shown is the average confidence rating for the new design minus the old design (so higher values favor the new design). Both tasks show that users were more confident on the new design than the old because the mean difference is greater than zero. But are the scores just a by-product of small sample sizes?
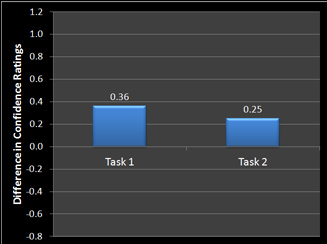
Figure 2: Difference in average confidence ratings for two tasks (New Design-Old Design). Higher numbers indicate more confidence on completing tasks for the new design.
The next graph shows the same tasks with 90% confidence intervals around the mean difference in confidence ratings. Only Task 1’s error bars do not cross zero and show that the higher confidence was statistically significant.
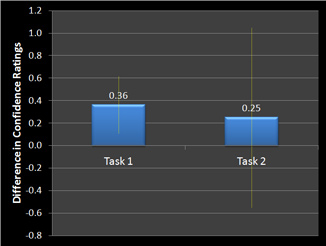
Figure 3: Same values shown as in Figure 2 now with 90% confidence intervals. The confidence interval for Task 1 doesn’t cross zero showing that users are statistically more confident on the new design.
Misconception 8: Usability data isn’t normally distributed.
Reality: Task time, rating scale data and completion rates when graphed don’t follow a nice bell-shaped “normal curve”. However, the sampling distributions of the mean follows a normal distribution, even for small sample sizes in most situations. When there is a significant departure from normality, there are some simple adjustments to make the calculations accurate at any sample size. See Chapter 3 in Quantifying the User Experience.
Misconception 9: Using statistics costs more money.
Reality: The calculations don’t cost money. Learning statistics, like learning how to conduct a usability test does require a commitment to learn and apply. Ironically, this is also a common argument for not conducting usability testing: it costs too much.
There are free calculators, books and tutorials to get you started improving the rigor of your usability test. The first lesson is that statistics and usability analysis are a natural fit for making a quantifiably better user experience.


