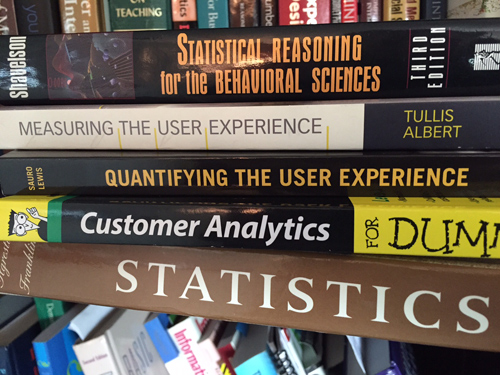
 Geek out this summer and catch up on some stats.
With your kids home from school with their reading lists, now’s the perfect time to create a reading list of your own to tackle this summer.
I know reading statistics articles probably isn’t your idea of a summer vacation; however, I’ve selected ten articles from MeasuringU.com that are approachable and applicable.
The articles are ordered from more general to more specific topics.
- Understand your data types: Start with knowing how to classify your data between qualitative and quantitative. With quantitative data, you can further subdivide data into discrete and continuous. Knowing the type of data you have allows you to properly summarize it, select the right statistical test, and determine the right sample size.
- Measure the variability: To summarize data you usually need a measure of the middle (like the mean or median) and some measure of spread (like the standard deviation). The variability impacts the sample size and precision of your estimates and is a key ingredient in confidence intervals, statistical tests, and sample sizes.
- Know what statistical test to use: The “right” statistical test largely depends on the type of data you have and whether you’re making a comparison. A decision tree is helpful.
- Understand what statistically significant means: Just because you see a difference, doesn’t mean it’s not due to sampling error. Know how to not be fooled by randomness and understand this essential concept in statistics.
- Compute a confidence interval: Understand how much your sample average can fluctuate due to sampling error in five steps.
- Determine how confident you need to be: The level of confidence you need depends on the consequences of being wrong. It should be lower for exploratory research and high for clinical research.
- Measure reliability: Know how to measure the consistency in your metrics and methods.
- Measure validity: Know whether your metrics are measuring what you intend to measure.
- Know what an effect size is: The size of the differences is the biggest factor when computing sample sizes and is often a good indication of practical significance (which is different than statistical significance).
- Find associations in data: Learn how to compute the correlation for continuous data and binary data and use the correlation to predict customer behavior and attitudes.
If you want to learn more about statistics, join us and fellow researchers at the Denver UX Boot Camp and many of these topics are covered in Customer Analytics For Dummies and Quantifying the User Experience.


