 It’s usually the first and most difficult question to answer when planning a usability evaluation:
What sample size do I need?
There are some who will just say it doesn’t matter what the sample size is because usability is qualitative…and after all any users are better than none.
Others will say that you only need to test with five users.
And yet others will pick another larger number that seems about right.
There are actually good ways for estimating the sample size that don’t rely on intuition, dogma or conventions.
Determine the Type of Usability Evaluation
To find the answer you first need to identify the type of usability evaluation you’re planning:
Detecting usability problems in an interface: This is the classic reason for usability testing and involves identifying problems users have and what in the interface is causing them (then usually fixing them).
Estimating a parameter: Like the completion rate of all uses, the average task time, the perception of usability, the average Net Promoter Score.
Making a Comparison: Are you comparing two or more interfaces to see which one generates higher completion rates, shorter task times or higher satisfaction scores?
Comparing to a Benchmark: Are you seeing if the completion rate exceeds a benchmark (e.g., 70%) , if a task can be completed in under a minute or seeing if the SUS score is above average?
Most usability evaluations should fall within one of these categories. And the most common is the first category of detecting usability problems. If a company is going to spend any money on usability it will be first dedicated to finding and fixing usability problems early and often. So I’ll walk through the strategy I recommend and use with clients when finding the right sample size. I’ll cover the other categories in future articles.
Sample Sizes for Finding Usability Problems
Finding the right sample size is a tradeoff between the cost of running participants and the ability to detect usability problems. The larger the sample size, the more usability problems that get uncovered. There is however a diminishing return as fewer new usability problems get uncovered with each additional user.
Not all usability problems uniformly affect all users. Users (as all of us do) bring varied experiences, expectations and knowledge to interfaces as they attempt to accomplish goals. The variation across users is huge. Some people will have problems finding a product to purchase while others will find the product with little effort.
We then should think in terms of the percentage of users particular usability problems will affect. Some problems are going to affect a lot of users, for example, a problem with the login screen or shopping cart may affect many users (e.g. 30%-60%). While other problems will affect fewer users, for example, an advanced reporting features in software (e.g., 1% to 10% of users).
The fewer users that a problem impacts, the larger the sample size you will need to have a good chance of finding it in an evaluation.
So the best way to make a sample size decision is to
- Pick the minimum problem percentage you want to detect. For example you want to uncover problems that impact at least 5% of users. That means you want to see problems that affect 5%, 10%, 50% or 99%+ of the users.
- Identify how sure you want to be you’ll see these issues in a usability evaluation. For example 80%, 85%, 90% or 99% likely. It’s important to remember that a problem could exist and actually impacts 10% of your users, but just by chance, the users that do have a problem with an element in your design aren’t in your evaluation.
- Use the binomial probability formula to determine the sample size needed based on the chance of seeing the problem and its occurrence. The formula is simple: log(1-Chance of Detecting) / log(1-Probability of Occurring).
For example, if you want to identify problems than impact 10% or more of your users and you want to have an 85% chance of seeing them (if they exist) in a usability test, then you need plan on observing 18 users : log(1-.85) / log(1-.10) = 18.006.
If you want to see just more obvious problems that affect 1/3rd or more of users and have the same chance of seeing them you need to test 5 users: log(1-.85) / log(1-.33) = 4.73.
If you want to see those less obvious problems (1%) then you should have a lot of time and budget to observe 189 users: log(1-.85) / log(1-.01) = 188.72.
As you can see it’s an exercise in trading off wanting to see as many problems as possible while still working within a budget. Keep in mind that even at small sample sizes (for example 7) you still can see problems that only affect 1% of users, it’s just that it’s not terribly likely (about a 6.8% chance actually).
To help with this decision and planning process I have a popular excel calculator available for download. It allows you to try all sorts of “what-if” scenarios to see the percent of problems you’d likely uncover at given sample sizes.
For example, the graph below shows the chance of seeing problems that affect different percentages of users at sample sizes of 7 and 15. We can see that you have a pretty good shot at seeing even problems that affect as few as 10% of users when you evaluate 15 users but only about a 50% chance of seeing the same problems if your sample size is 7.
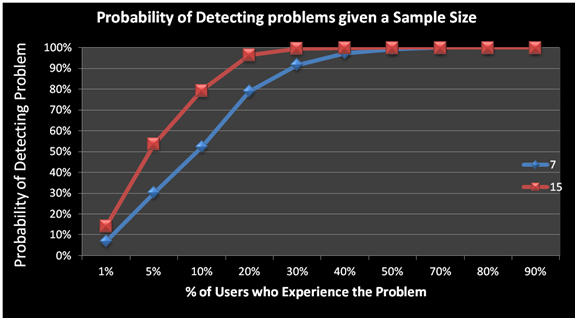
Figure 1: Graph showing the % of usability problems uncovered by testing 7 vs. 15 users. For example, you have around an 80% chance of seeing problems that impact 10% or more of users at a sample size of 15 users, compared to 50% at a sample size of 7.
Guidance on Problem Frequency
Of course, there is a bit of a catch 22: If you know how common the usability problems are in your interface, then you probably know they exist and would fix them. However, we can still estimate the likely problem occurrence using two approaches:
First, if we know something about the system and how usable it is, we can estimate approximately how common problems are. A new application which has had little testing would likely have a lot of usability issues affecting most users (30%+) five users would reveal most problems. More refined and released applications would have less obvious problems (<30%) and would need more than 5 users to have good chance of seeing them.
As an additional guide, you can take a look at some common problem occurrences across business software, consumer software and websites. In general, business software has usability problems that are about 10 times more common than websites. You would need a much smaller sample size for early stage business software than you would for a high-traffic website.
The bottom line is that you can effectively estimate the sample size you need in a usability test based on how confident you want to be you’ll see problems that affect a certain percent of users–assuming you sample the same type of users, attempting the same task on the same interface.


