 You don’t need a PhD in statistics to understand and use confidence intervals.
Because we almost always sample a fraction of the users from a larger population, there is uncertainty in our estimates.
Confidence intervals are an excellent way of understanding the role of sampling error in the averages and percentages that are ubiquitous in user research.
- Confidence intervals tell you the most likely range of the unknown population average or percentage such as the average completion rate, the average level of satisfaction or the percentage of users likely to recommend your product. Note: Confidence intervals don’t tell you the likely range of all values, just how much the average value is likely to fluctuate.
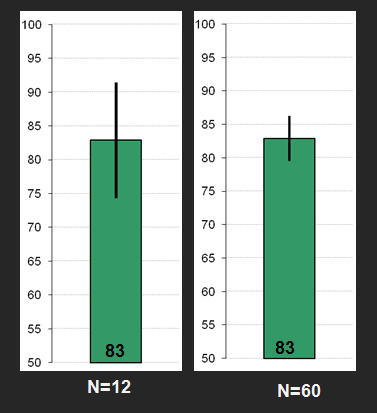
- Confidence intervals provide both the location and precision of a measure: For example, the graphs below show the 95% confidence intervals around the average System Usability Scale (SUS) score. The only difference between the graphs is the sample size. Even though they both show the same location (a mean score of 83), the one on the right has a larger sample size (60), making it a more precise estimate of the population SUS score than the sample with only 12.
- Three things impact the width of a confidence interval
- Confidence level: This is the 95% part of the 95% confidence interval and also typically takes values of 90%, 99%, 80% and 85%. Confidence levels are the “advertised coverage” of a confidence interval. If we were to sample from the same user population 100 times, we’d expect the average to fall within the interval 95, 90 etc., times out of 100.
- Variability: as measured by the standard deviation. Populations (and samples) with more variability generate wider confidence intervals.
- Sample Size: Smaller sample sizes generate wider intervals. There is an inverse square root relationship between confidence intervals and sample sizes. If you want to cut your margin of error in half, you need to approximately quadruple your sample size.
- The confidence interval is equal to two margins of errors and a margin of error is equal to about 2 standard errors (for 95% confidence). A standard error is the standard deviation divided by the square root of the sample size. The standard error is standard deviation of the sampling distribution of the mean, or in English, it’s basically the amount we expect the sample mean to fluctuate for a given sample size due to random sampling error.
- For rating scale data (like the SUS, SUPR-Q or SEQ) use the t-confidence interval method. You just need to know the mean, standard deviation, sample size and confidence level or you can use the online calculator to compute an accurate interval at any sample size.
- For confidence intervals using task times you should perform a log transformation on the raw values, and then compute the t- interval method. This method corrects for the skew in task time data to generate accurate intervals. Use the online calculator to perform the calculations.
- For binary data coded as 1’s and 0’s (Pass/Fail, Yes/No) use the adjusted wald method which provides accurate intervals at any sample size. It works by “adjusting” the proportion by adding two successes and two failures and generates accurate intervals for any sample size.
- Confidence Intervals can be computed on sample sizes as small as two: The intervals will be very wide but there’s nothing with the math preventing you form computing them. With small sample sizes you can show that an interface is unusable, but it’s harder to show it’s usable. For example, if 0 out of 2 people can complete a task, there’s only about a 5% chance more than half of all users will.
- We are 95% confident in the method of computing confidence intervals, not in any given interval. Any given interval we compute from sample data may or may not contain the population average. Even though 95% of samples will contain the interval we don’t know if the one sample we took is one of the 5% that don’t contain the average.
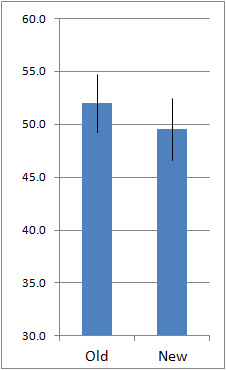
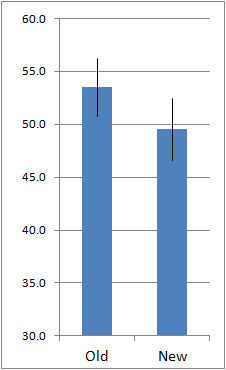
- You can use the overlap in confidence intervals as a quick way to check for statistical significance. If the intervals do not overlap then you can be at least 95% confident there is a difference (for 95% confidence intervals). If there is a large overlap, then the difference is not significant (at the p <.05 level). The intervals can actually overlap by as much as 25% and still be statistically significant, so when there is some overlap, it’s best to conduct the 2-sample t-test and find the p-value. The three graphs below illustrate this.
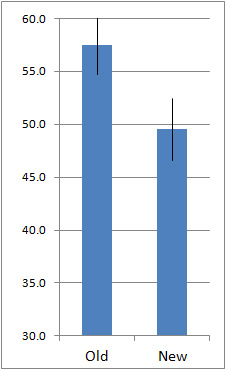
No Overlap: Significantly different (p <.05)
Lots of Overlap: Not Significantly different ( p >.05)
Some Overlap: Can’t tell, run the 2-sample t-test (turns out p =.04, go publish!)
We have a chapter dedicated to confidence intervals in our book Quantifying the User Experience (Chapter 3) and in the Companion Book (Chapter 3) which contains step-by-step instructions for computing the interval in R or the Excel statistics package.
I’ll be offering a tutorial which will include confidence intervals this fall at the Denver UX Boot Camp.
