 Here are at least 10 things to know about using this popular user research method.
- Card Sorting involves having users (not designers, developers or VP’s) sort a list of pages or categories together based on their understanding of the structure and relationship.Card sorting is useful for such things as finding out how users would group merchandise at an ecommerce website that has a huge selection of products and categories.
- The goal of card sorting is to generate a user-centered taxonomy which, among other things, should result in a better navigation structure for a website (less time to find products, higher conversion rates and a happier world for all of us).
- There are two types of card sorts:Open Sort: Users are asked to sort items into a group and make up their own groups and give the groups a name.
Closed Sort: Users sort items into previously defined category names. - Roughly half (52%) of UX professionals report using card sorting, about the same as in 2009 and up from 46% in 2005 (the 13% increase is statistically higher) [Source UPA annual Salary Survey].
- In a survey of 217 attendees of Usability Week 2008, Nielsen Norman Group reported that the average number of card sorts conducted per year was 2.
- How long does it take to perform a card sort? Well it depends on the number of cards and complexity of the categorization but William Hudson offers some guidance:
- 20 minutes for 30 items
- 30 minutes for 50 items
- 60 minutes for 100 items
- Card sorting can be done by hand (hence the term card) but is now usually performed using software which allows for users from around the world to sort and generates fancy graphs and percentages. Popular packages include: OptimalSort and Websort. Note: We have a business relationship with OptimalSort.
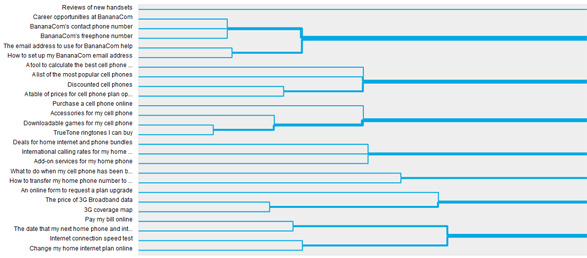
- Identifying groups of categories is often done using cluster analysis and results in a figure called a dendrogram. An example dendrogram from OptimalSort is shown below. Interpreting the groups in dendrograms is notoriously subjective, especially when there isn’t high agreement between users. Using Factor Analysis may lead to better discrimination.
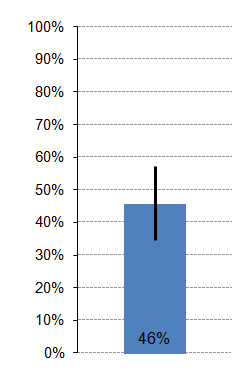
- Confidence : Use confidence intervals around the percentage of items that were placed within a group to estimate the likely percentage of the total user population that would also group the cards that way. For example, if 32 out of 70 participants placed “Getting a New Person Started” in the “Hiring” category of an HR application, we can be 95% confident between 35% and 58% of all users also would place the card there (a margin of error or 11%).
- Sample Size: There is surprisingly little guidance on finding the right sample size for a card sorting study. Tullis and Wood (2004)[pdf] performed a resampling study with one large card sort involving 168 users and found the cluster results would have been very similar (correlations above .93) at sample sizes between 20-30.Another services is based on finding the desired amount of precision around the percent of users who place cards in each category. It’s basically working backwards from the confidence intervals. For example, to have a margin of error of around 7% you should plan on having around 193 participants.
Sample Size Margin of Error (+/-) 10 27% 21 20% 30 17% 39 15% 53 13% 93 10% 115 9% 147 8% 193 7% 263 6% 381 5% 597 4% 1064 3% The computations are explained in Chapter 3 and Chapter 6 of Quantifying the User Experience.


