You know the scenario.
You’re browsing books on Amazon, and you scroll down to see the now-familiar phrase: “Customers Who Bought This Item Also Bought…” Amazon then presents you with a list of books that, in many cases, are of interest to you.
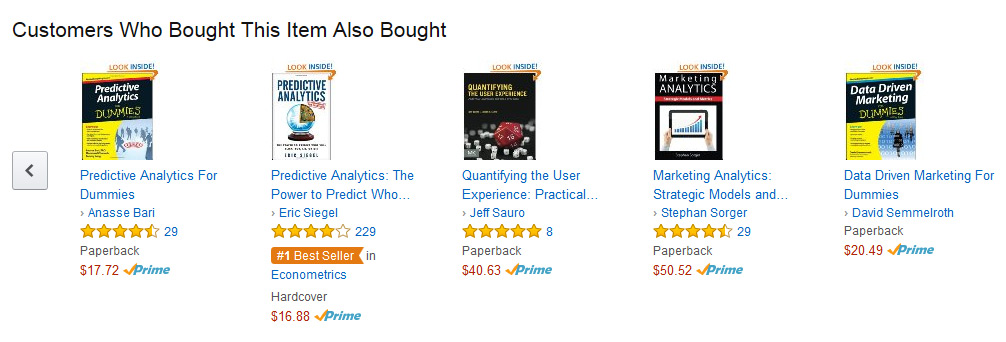
Have you ever wondered how Amazon knows what books to recommend?
The recommendations are a result of a technique called an affinity analysis (sometimes called a basket analysis). While Amazon wasn’t the first to use the technique, they certainly get credit for making it famous.
While the exact algorithm Amazon uses is proprietary, we know that it’s based on the fundamental approach used in an affinity analysis: identifying the association of people who purchase one book and also purchase other books. But you don’t need access to the computing resources of Amazon to create an affinity analysis for your research. The association is based on the same principle of correlation we use between continuous variables.
How to Conduct Your Own Affinity Analysis
Amazon bases its recommendations on a binary variable: view/didn’t view or purchase/didn’t purchase. To generate a recommendation, Amazon computes the proportion of customers that purchase a book and the proportion of those customers that purchase other books. (For a refresher on binary data and proportions, see the post on data types, or Chapter 2 of Customer Analytics for Dummies.)
Often the hardest part of making data-based decisions is collecting and formatting the data.
You’ll want to arrange your data in rows and columns. The example (Figure 1) covers 15 customer transactions involving any of four books (Books A, B, C, and D). These could just as easily be software products, groceries, songs in a playlist, TV shows, or any other products or services.
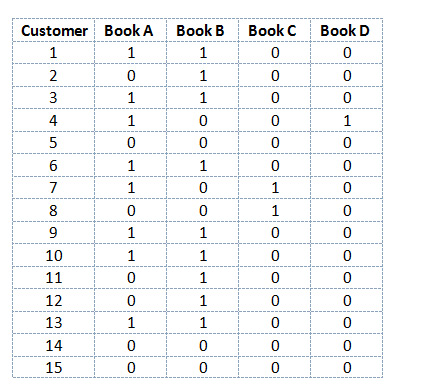
Figure 1: Purchases per customer. 1 = purchased; 0 = did not purchase.
Customer 1 purchased Book A and Book B, and not Book C or Book D. Customer 2 purchased Book B and none of the others. On the Amazon site, book pairs with the highest association are recommended first, pairs with the next-highest associations are listed next, and so forth.
Keep in mind that in this matrix, all 15 customers were exposed to all four books. Considering a book and not purchasing it is different than not purchasing after not even seeing the book. So be sure if a customer is assigned a 0 in this matrix, it’s because they didn’t make a purchase and not that they didn’t see it.
Computing the Correlation
An association between binary variables is called a phi correlation, and is represented with the Greek symbol φ. You can compute phi by hand or by using the Excel function =PEARSON().
To calculate phi by hand, follow these steps :
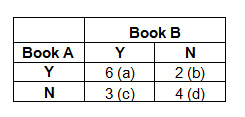
- Arrange your data into a contingency table as shown below for each pair of books. Each cell is labeled from a to d. Six customers purchased both Book A and Book B, 2 purchased Book A but not Book B, and so forth.
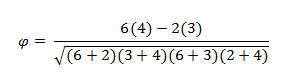
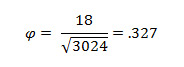
- Then compute the phi correlation using the following formula:

- Plugging in the values gets a phi correlation of .327.
Here (Figure 2), I set up the data in Excel and used the =PEARSON() formula, and also got the correlation of .327.
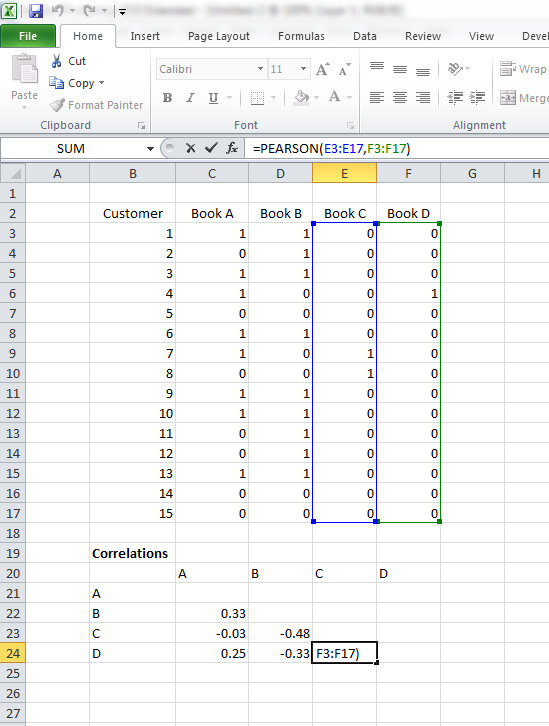
Figure 2: Book purchases and correlations computed in Excel using the Pearson() formula.
The phi correlations of the pairs of books purchased are shown in Figure 3 below. For example, the phi correlation between Book A and Book B is 0.33 (rounded up from .327); the correlation between Book A and Book D is 0.25. You don’t need to correlate a book with itself (so cells A:A, B:B etc. are blank) and the top-half of the matrix is blank because it’s a duplication of the data on the bottom.
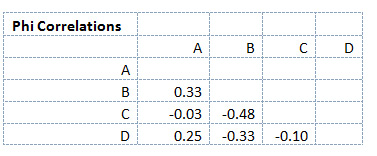
Figure 3: Correlation matrix of each book combination.
Since we can interpret the association between binary numbers similarly to the way we interpret the Pearson correlation r, we would consider the correlation between Book A and Book D to be a medium-strength correlation.
Technical note: Phi correlations are artificially restricted based on the proportions, so they likely underestimate the actual association [PDF].
In affinity analysis, however, the absolute strength is usually less important than the relative strength. Near-zero correlations mean that customers have (so far) shown no purchasing affinity with the other products. Negative correlations mean that customers who purchase one item are LESS likely to purchase the other. For example, the correlation between Book B and Book C is -0.48. The reason is that customers in this sample who bought Book B never bought Book C, and those who bought Book C never bought Book B.
In our scenario, if a customer were viewing Book A, it would make sense to recommend (and possibly offer that customer an incentive to also purchase) Book B and Book D because Book A has a positive correlation with both those books.
Of course you don’t need to present your customer with affinity choices in real time, as Amazon does. You can instead make your calculations offline based on historical data. The value in affinity analysis comes in understanding which items customers purchase together, predicting future customer behavior, and then planning your pricing, promotion, and product-design initiatives accordingly. Also keep in mind that you don’t have to look at just what customers purchase simultaneously. As in the Amazon example, many of these purchase associations come from purchases that are made over time and not simultaneously.
Reminder: Just because two items are correlated doesn’t mean one causes the other. The more correlations you compute, the more likely you are to get positive correlations from chance alone. There are plenty of examples of nonsensical associations between variables. While it’s easy to compute a correlation, it can be a lot harder to know if the associations you see are from an underlying relationship are from chance.
Conclusions
Here are a few things to remember about using an affinity analysis for your next project:
- An affinity analysis is a mathematical way of understanding how two variables (usually binary) are associated.
- Association between binary variables can be computed using the phi correlation from data set up in a contingency table.
- The Pearson correlation is a shortcut for the phi and can be easily computed in Excel.
- Phi correlation can be interpreted similarly to the Pearson correlation, with higher values indicating greater purchase affinity.
- While correlation does not guarantee causation, it can help us predict behaviors.


